Ethernet
The Ethernet protocol in InDataX allows creating a TCP server to which other devices can connect to send data frames. It is ideal for integrating devices that have been configured to "push" information in text formats or custom byte sequences over the network.
Protocol Configuration
To configure the communication, the following parameters must be defined in the Modelizer:
- Name (Nombre): Unique identifier for this protocol.
- IP Address (Dirección IP): Used as a security filter. Here you indicate the IP addresses of the devices authorized to connect. If you need to allow multiple devices, you can add their IPs separated by commas (e.g.,
192.168.1.10, 192.168.1.11). If left blank, connections from any IP address will be allowed (not recommended for security reasons). - Port (Puerto): The local port on which InDataX will open the server and listen for incoming connections. Make sure the selected port is free on the system and that the network security configuration (Firewall) allows traffic through it.
Even if an IP address is not on the authorized list, if it attempts to send data, its frames will still be displayed in the Log Viewer. This is very useful for identifying the IP of a new device and verifying what data it is sending before formally authorizing it.
Once configured, the Variable Management (Gestión de Variables) button allows defining which data we want to extract from the communication.
Variable Configuration
In this protocol, variables are extracted by segmenting the received data frame. InDataX interprets the frame as a string of characters and "crops" the necessary parts based on positions:
- Name (Nombre): Identifying name of the variable.
- Type (Tipo): The data type to which the extracted text will be converted (e.g., Real, Integer, etc.).
- Audit trail: If enabled, the system will keep an audit record every time the variable value changes.
- Record value (Registrar valor): If checked, the value of this variable will be included in the historical records of the associated Thing.
- Frame Start (Inicio trama): The character position where the data for this variable begins within the frame.
- Frame End (Final trama): The character position where the data for this variable ends.
System Logs Viewer
To facilitate variable configuration and position identification within the frame, InDataX features a real-time log viewer.
How to access
Right-click on any empty area of the Modelizer canvas and select the System logs (Logs del sistema) option.

Viewer Usage
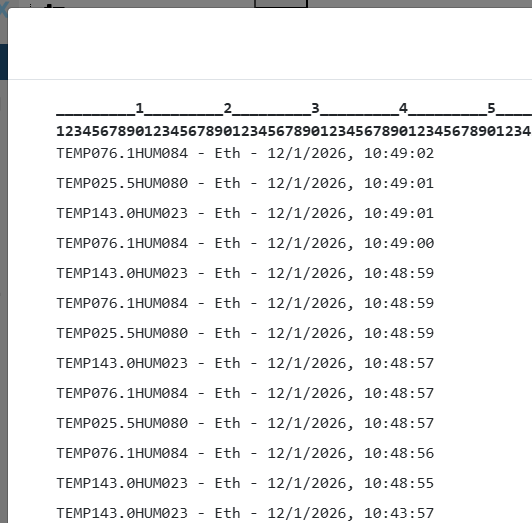
The viewer shows incoming frames (both from Ethernet and USB Serial) along with a numeric legend at the top. This legend allows you to quickly identify the index of each character, making it easier to define the Frame Start and Frame End fields.
In addition to the raw data frame, InDataX automatically appends contextual information to the end of each line:
- The protocol the frame belongs to.
- The exact date and time when the system received the information.
Please note that these additional data points (protocol and date/time) are exclusive to the log viewer. They are not part of the actual raw data frame sent by the device, and therefore cannot be captured via variables. When configuring Frame Start and Frame End, you must base your indexing solely on the device's raw data.
At the top, you have a text Filter that allows you to search for specific strings within the logs, which is very useful for isolating frames from a specific device in high-traffic environments.
Example
Suppose the server sends the following frame: TEMP025.5HUM080
To read the data, we would configure:
- Temperature Variable: Start:
5, End:9. The system will extract025.5. - Humidity Variable: Start:
13, End:15. The system will extract080.
Positions in InDataX start at 1. You can use the frame viewer to visually identify the exact position of each data point.